Calculating an Average Annual Growth Rate in MetrixND
September 20, 2017
Share this story on:
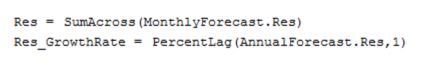
After finishing my forecast, I like to present forecast average annual growth rates. These results are calculated by converting the monthly forecast into annual values using a Transformation table with an annual periodicity. The formulas used in the annual Transformation table are shown below.
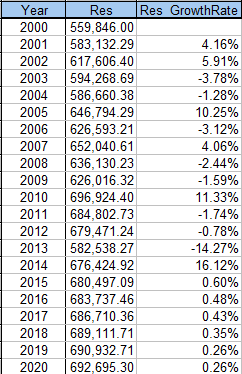
In these equations, the “Res” variable sums the monthly residential sales forecast into annual sales using the “SumAcross” function. The “Res_GrowthRate” variable calculates the year-to-year growth rates using the “PercentLag” function and the newly created “Res” variable. The results shown below are annual sales and growth rates.
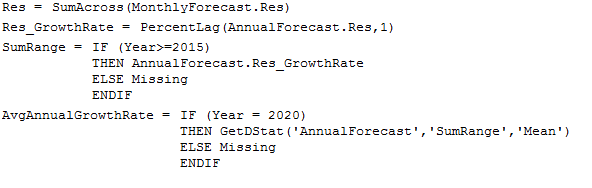
While year-to-year numbers are valuable, most forecasters like to communicate average annual growth rates. In this case, what is the average annual growth rate for the forecast? To calculate this, I added two new variables in the annual Transformation table, “SumRange” and “AvgAnnualGrowthRate” as shown below.
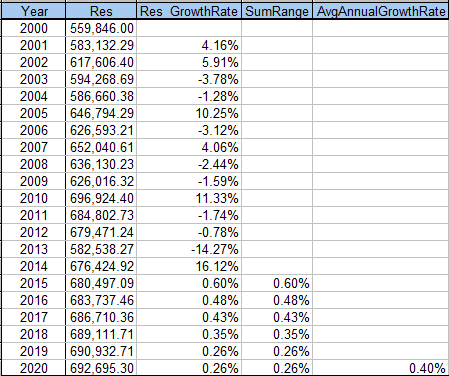
The “SumRange” variable isolates the forecast period, which, in this example, begins in 2015. The variable uses the “IF-THEN-ELSE-ENDIF” function to remove any values which are not defined in the IF condition. In this case, all the values prior to 2015 are removed as shown below.
The “AvgAnnualGrowthRate” variable takes the “SumRange” results and obtains the average to present the average annual growth in the forecast period. The key component of this variable is the “GetDStat” function. This function obtains the variable average (mean) from the DStat tab. The IF condition is used to place the annual average growth rate in the year 2020 row.
Typically, the average annual growth rates are calculated in a spreadsheet. Forecasters copy and paste results into a spreadsheet where annual averages are easily calculated. However, using the two variables described above allows for the dynamic calculation of results, removing the need to copy and paste into the spreadsheet.
Mark Quan est consultant principal en prévisions au sein de la division des prévisions d'Itron. Depuis qu'il a rejoint Itron en 1997, M. Quan s'est spécialisé dans les solutions de prévision énergétique à court et à long terme, ainsi que dans les projets de recherche sur la charge. Quan a développé et mis en œuvre plusieurs systèmes de prévision automatisés pour prédire la demande système du lendemain, les profils de charge et la consommation au détail pour des entreprises aux États-Unis et au Canada. Les solutions de prévision à court terme comprennent des systèmes pour le « Midwest Independent System Operator » (MISO) et le « California Independent System Operator » (CAISO). Les solutions de prévision à long terme comprennent le développement et le soutien des prévisions à long terme (ventes et clients) pour des clients tels que « Dairyland Power » et « Omaha Public Power District ». Ces prévisions comprennent des informations sur l'utilisation finale et les impacts de la gestion de la demande dans un cadre économétrique. Enfin, Quan a participé à la mise en œuvre de systèmes de recherche de charge, notamment chez Snohomish PUD. Avant de rejoindre Itron, Quan a travaillé dans les secteurs du gaz, de l'électricité et de l'entreprise chez Pacific Gas and Electric Company (PG&E), où il a participé à la restructuration du secteur, à la planification de l'électricité et à la planification du gaz naturel. M. Quan est titulaire d'un master en recherche opérationnelle de l'université de Stanford et d'une licence en mathématiques appliquées de l'université de Californie à Los Angeles.