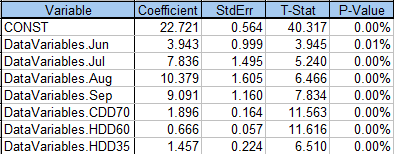
MetrixND provides several options for determining whether a variable is useful. Typically, a model builder reviews the variable coefficients, standard error, t-statistic and p-values. These statistics are located on the “Coef” tab as shown below.
An evaluation of the variable coefficients shows that each variable is significant and behaves as expected. For instance, the CDD70 variable has a t-statistic of 11.563 (statistically significant) and indicates that when cooling degree days (CDD70) increase, sales increase by 1.896 units.
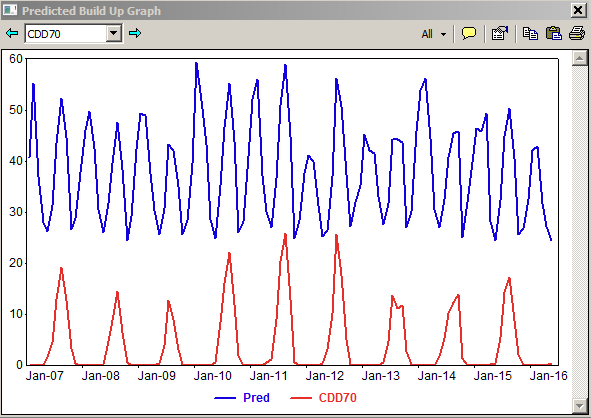
While these numerical results are useful, a graphical depiction of the variable aids the understanding of the variable’s contribution to the model. In the regression model object, the BX tab provides the picture of each explanatory variable’s contribution to the predicted value.
In the figure below, the contribution of CDD70 (red line) is compared to the model’s predicted value (blue line). Formally, the CDD70 line is calculated from the CDD70 variable value and the CDD70 coefficient (BCDD70 x XCDD70).
The power of the graphic is visual clue about what each variable is doing to generate the predicted value. In this example, the CDD70 variable is responsible for the summer cooling shape.
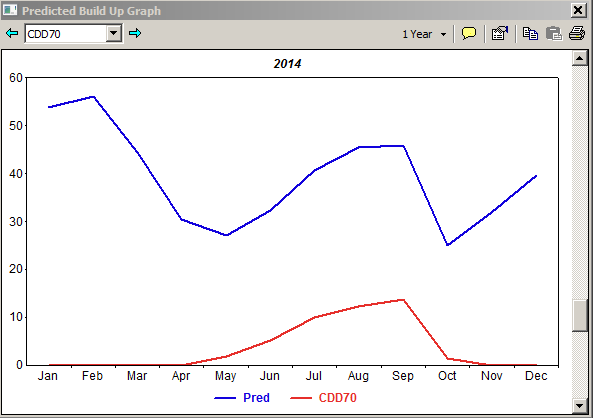
A closer inspection of the graphic (zooming into 2014 in the figure below), shows how CDD70 only contributes to the predicated values in May through October. So while the predicted value decreases from April to May, the graphic tells us the decrease is not caused by the CDD70 variable because CDD70 does not contribute to the April predicted value.
Coupled with the traditional variable statistics, the BX view enhances the model builder’s understanding of variable’s contribution and power. Begin using the BX tab and add it to your box of model building tools.
Mark Quan is a Principal Forecast Consultant with Itron’s Forecasting Division. Since joining Itron in 1997, Quan has specialized in both short-term and long-term energy forecasting solutions as well as load research projects. Quan has developed and implemented several automated forecasting systems to predict next day system demand, load profiles, and retail consumption for companies throughout the United States and Canada. Short-term forecasting solutions include systems for the Midwest Independent System Operator (MISO) and the California Independent System Operator (CAISO). Long-term forecasting solutions include developing and supporting the long-term forecasts of sales and customers for clients such as Dairyland Power and Omaha Public Power District. These forecasts include end-use information and demand-side management impacts in an econometric framework. Finally, Quan has been involved in implementing Load Research systems such as at Snohomish PUD. Prior to joining Itron, Quan worked in the gas, electric, and corporate functions at Pacific Gas and Electric Company (PG&E), where he was involved in industry restructuring, electric planning, and natural gas planning. Quan received an M.S. in Operations Research from Stanford University and a B.S. in Applied Mathematics from the University of California at Los Angeles.