For most things in life, I look forward to go forward. I keep my eyes on the road ahead. I look before I leap. I aim at my target. But this summer while we were on our family vacation, we rented a row boat and it reminded me that rowing a boat is different. When rowing, I face backward to maximize my power going forward. Forecasting electricity is like rowing a boat, we need to look backward to go forward.
Intuitively, we already do this by using regression models. Regression models look backward, find relationships and project them forward. Although too often, we leave the looking to models instead of our own eyes.
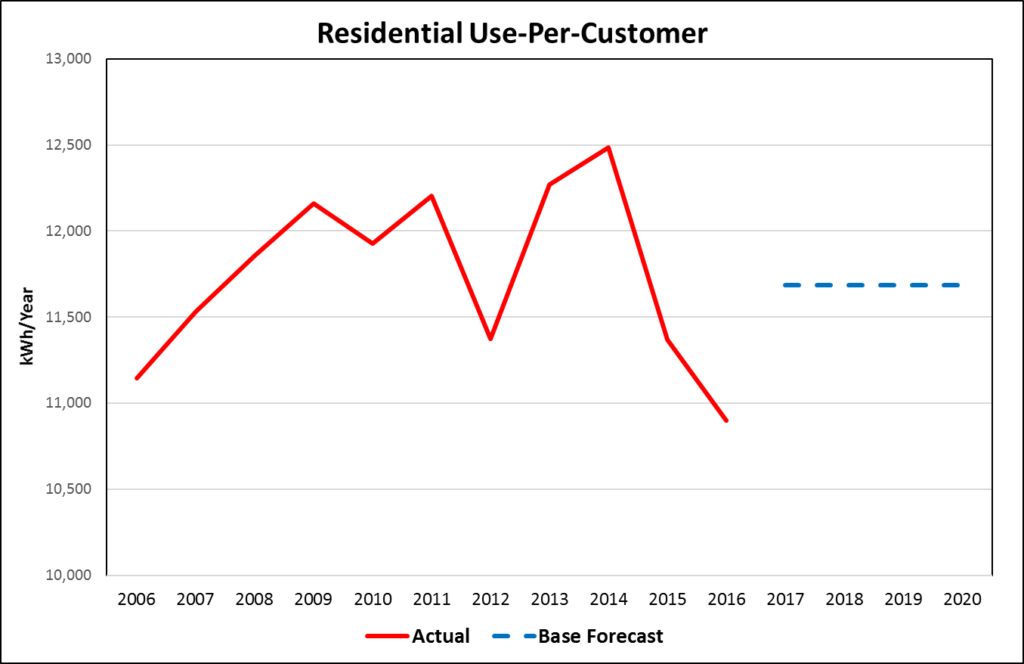
Below is annual historical average use for residential customers over an 11-year period. Leaving the forecast to a regression model with HDD, CDD, and some binary variables, the outlook is close to 11,600 kWh/year (blue dashed line) and flat because the model does not include any trend variables.
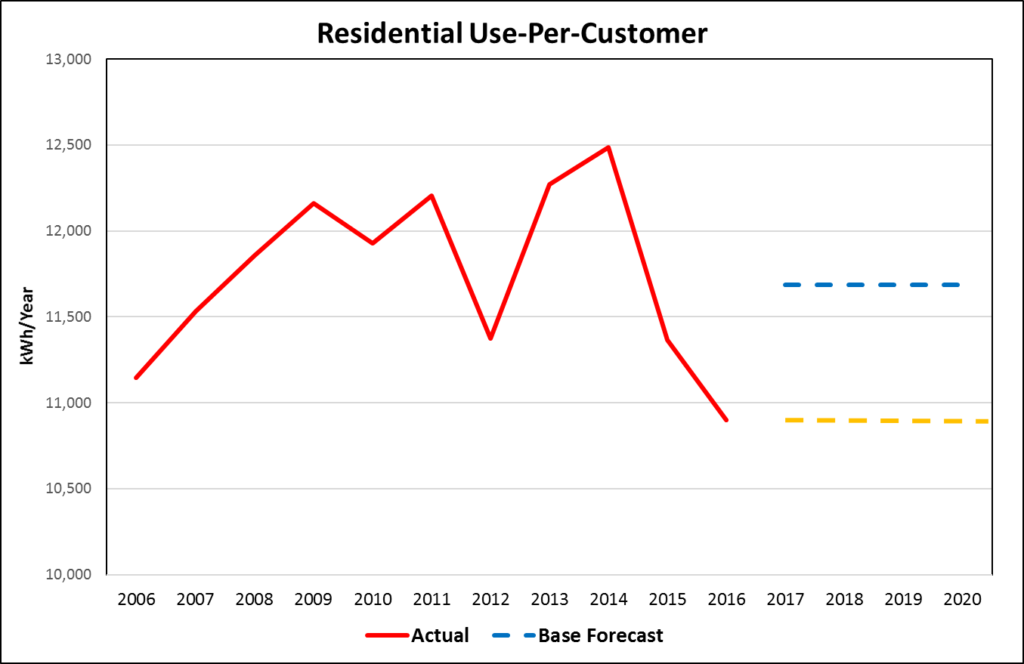
But, the last three years show dramatic decline in usage and raises the question of whether the forecast should be closer to 11,000 kWh/year (yellow-dashed line).
Instead of leaving the forecast to the model, we should use our own eyes to identify the underlying pattern in the history. Is average use declining?
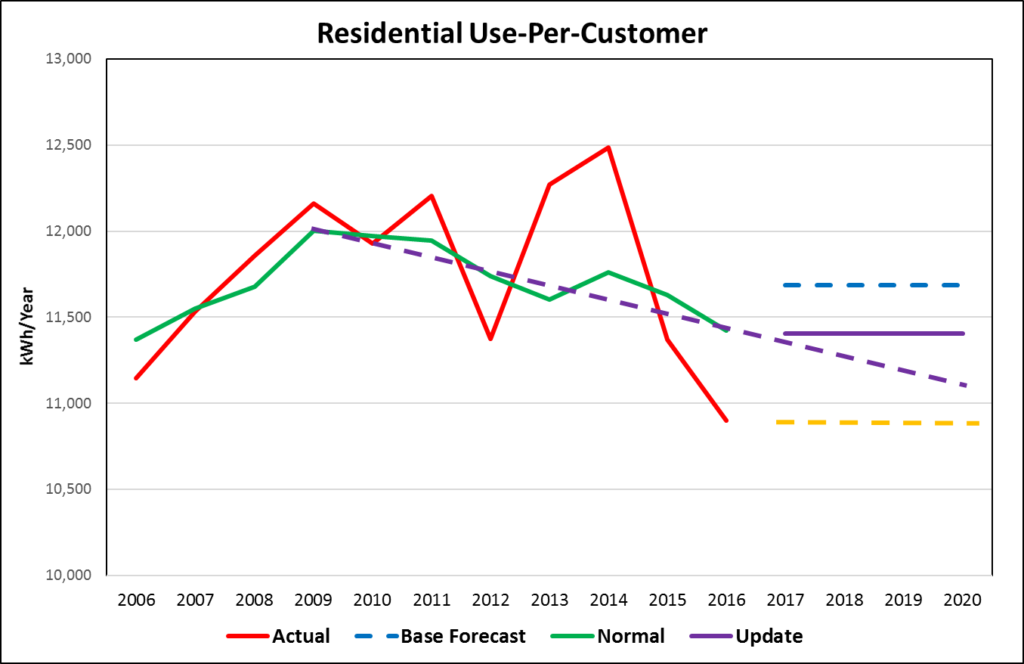
The only way to answer this question is to weather normalize historic average use removing the impact of weather variation. Weather normalization will answer the question of why 2016 was so low, why 2014 was so high, and what happened in 2012.
After weather normalizing historic average use, we can answer what happened in 2012, 2014, and 2016.
2012 was a mild weather year
2014 was an extreme weather year
2016 was a mild weather year
Additionally, we can see that average usage has consistently declined from 2009 to 2016.
If we assume the trend stops in 2016, the forecast should be close to 11,400 kWh (purple solid line). If we assume the trend continues, the forecast will be close to 11,000 kWh/year in 2020 (purple dashed line).
Weather normalization is an essential part of the forecaster’s work process. The process allows us to look backwards to ensure that we move forward in the right direction.
Mark Quan est consultant principal en prévisions au sein de la division des prévisions d'Itron. Depuis qu'il a rejoint Itron en 1997, M. Quan s'est spécialisé dans les solutions de prévision énergétique à court et à long terme, ainsi que dans les projets de recherche sur la charge. Quan a développé et mis en œuvre plusieurs systèmes de prévision automatisés pour prédire la demande système du lendemain, les profils de charge et la consommation au détail pour des entreprises aux États-Unis et au Canada. Les solutions de prévision à court terme comprennent des systèmes pour le « Midwest Independent System Operator » (MISO) et le « California Independent System Operator » (CAISO). Les solutions de prévision à long terme comprennent le développement et le soutien des prévisions à long terme (ventes et clients) pour des clients tels que « Dairyland Power » et « Omaha Public Power District ». Ces prévisions comprennent des informations sur l'utilisation finale et les impacts de la gestion de la demande dans un cadre économétrique. Enfin, Quan a participé à la mise en œuvre de systèmes de recherche de charge, notamment chez Snohomish PUD. Avant de rejoindre Itron, Quan a travaillé dans les secteurs du gaz, de l'électricité et de l'entreprise chez Pacific Gas and Electric Company (PG&E), où il a participé à la restructuration du secteur, à la planification de l'électricité et à la planification du gaz naturel. M. Quan est titulaire d'un master en recherche opérationnelle de l'université de Stanford et d'une licence en mathématiques appliquées de l'université de Californie à Los Angeles.